 The Problem with Disconnected or Inconsistent Reporting
Without a structured reporting process, it’s hard to consistently generate reliable, accurate insights.
Maybe you pull a few metrics here and there. Maybe your team looks at data when they get the time.
And maybe your quarterly reviews become rushed data dumps instead of strategic conversations.
Fragmented reporting creates real risks:
- Missed early warning signs that your campaigns are underperforming.
- Difficulty proving marketing’s contribution to revenue.
- Wasted time scrambling to assemble reports for leadership updates.
- Lower team morale because your wins aren’t being measured or celebrated properly.

Why Different Marketing Insights Require Different Reporting Cadences
Smart marketing reporting isn’t about collecting more data — it’s about collecting the right data at the right time.
Here at Clariant Creative, when we work with clients, we suggest a three-pronged reporting cadence. Each cadence serves a distinct purpose:
If you’re only looking at your performance once a month or once a quarter, you’re flying blind between reviews. But – just as dangerously – if you’re trying to monitor everything every day, you’re drowning in noise.
You need a system — one that’s lightweight, practical, and purpose-built for a busy marketing team.


As a marketing agency working with many marketing teams just like yours, we created a simple, intuitive, and informative solution to this problem that historically we shared only with our retainer clients. But we’re now ready to share this solution with everyone.
We are thrilled to show you the Clariant Creative HubSpot Dashboard Bundle: A complete set of ready-to-use dashboards designed to make weekly, monthly, and quarterly reporting easier, faster, and more insightful — even for lean marketing teams like yours.
Installed directly into your HubSpot portal, these dashboards give you a clear, actionable view of your HubSpot marketing performance without endless spreadsheets, disconnected data pulls, or hours spent building custom reports from scratch.
With this dashboard bundle, you can spend less time tracking metrics … and more time driving results.
This bundle was designed with our favorite buyer persona in mind: Resource-Challenged Rita — a marketing leader juggling strategy, execution, and reporting, often with a lean team and limited resources. If this sounds like you – and if you need fast insights without the overwhelm – this bundle is definitely for you.
Weekly Marketing Activity Review Dashboard to spot campaign health issues early.
Monthly Marketing Performance Overview Dashboard to evaluate trends and optimize tactics.
Quarterly Marketing Performance Summary Dashboard to connect marketing impact to business outcomes.

Why Weekly Reporting Matters
Weekly reporting helps you catch red flags early (for example, like an unexpected drop in website traffic or form submissions). It’s also helpful to maintain momentum on campaigns in progress and keep your marketing team aligned on short-term goals.
Rather than waiting until the end of the month to spot a problem, looking at key data points on a weekly basis sets you up to make quick adjustments and keep your team’s performance on track.
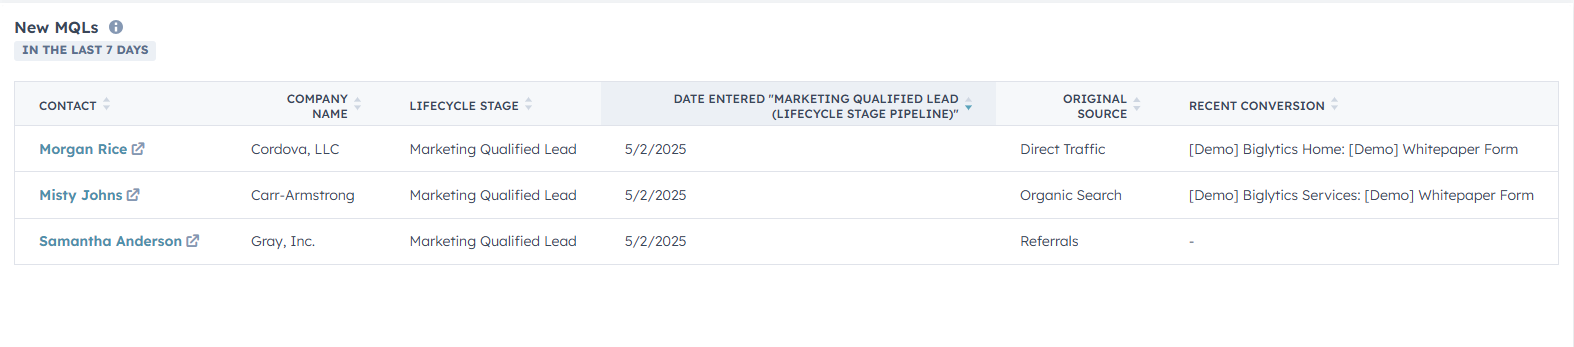
Chart showing new MQLs created over the last 7 days.
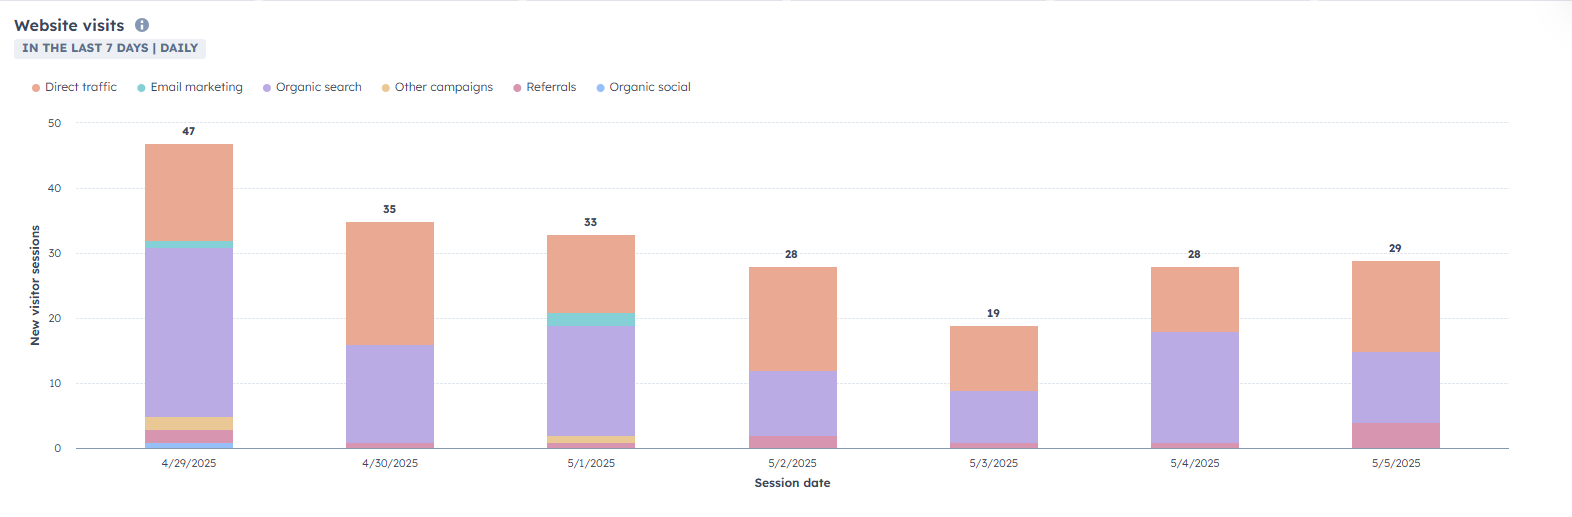
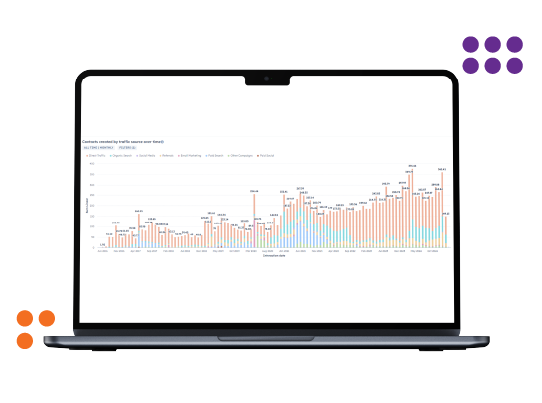
Bar chart of website visits by source over the past 7 days.
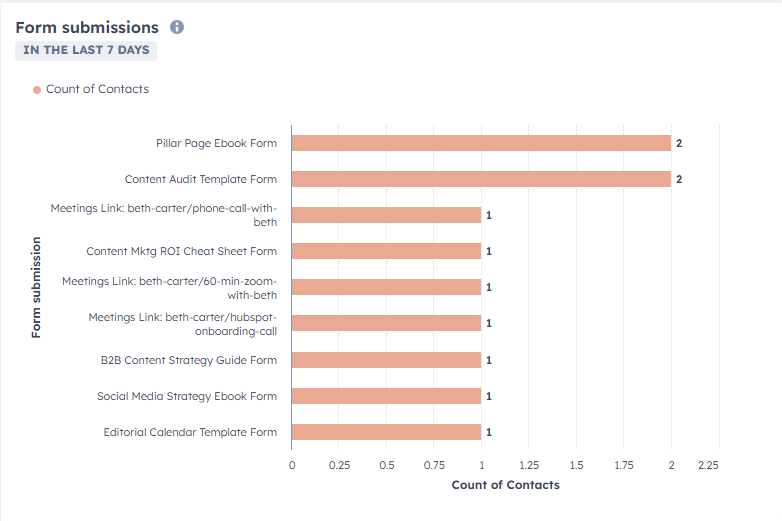
Chart showing number of form submissions from different offers over the past week.
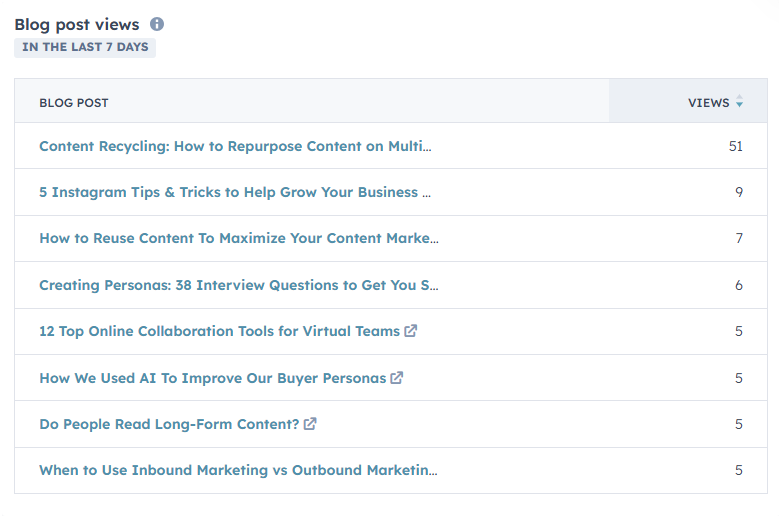
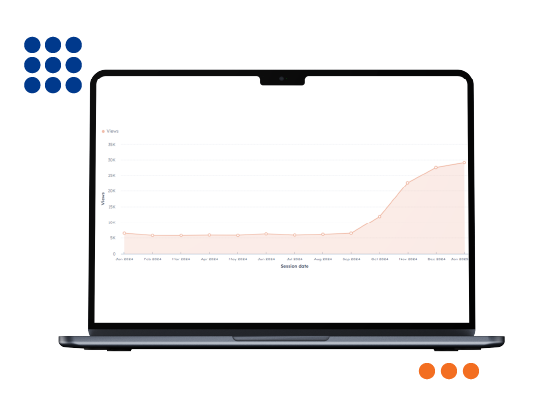
List of top-performing blog posts with view counts for the last 7 days.
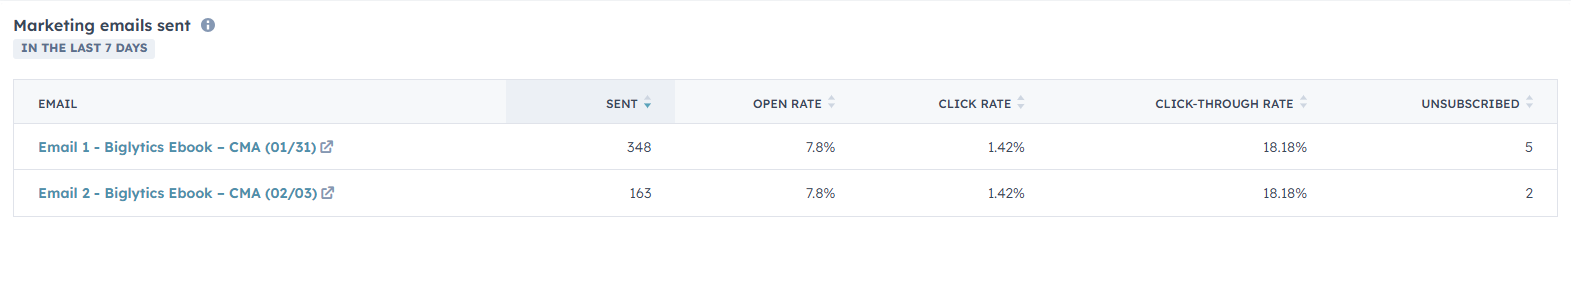
List of top-performing marketing emails sent in the last 7 days.

Why Monthly Reporting Matters
Monthly reporting gives you a bigger-picture view of your marketing trends, which is data you can use to fuel monthly campaign optimizations. This also provides critical insights on how your campaigns impact pipeline growth and sales enablement in HubSpot, which can shape your strategic discussions with your leadership team.
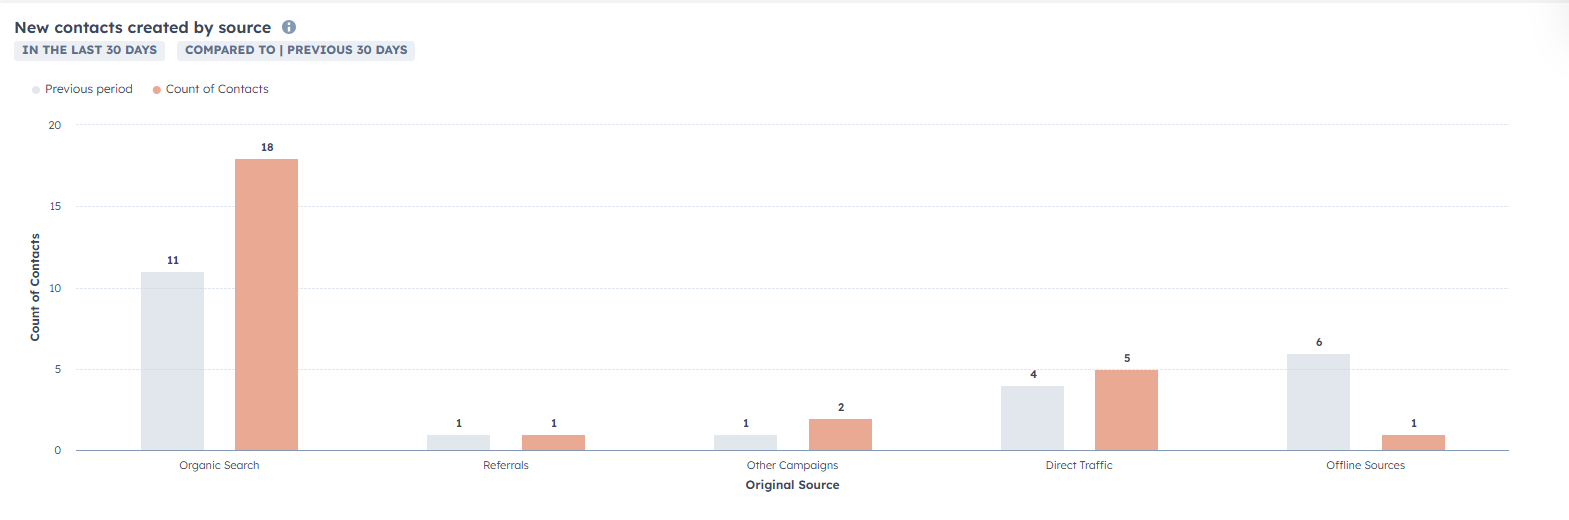
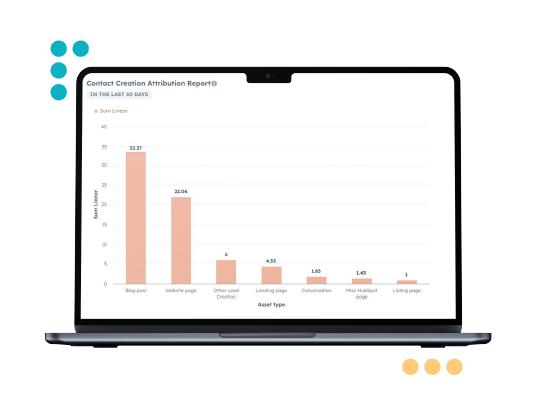
Monthly marketing dashboard summarizing new contacts created by source.
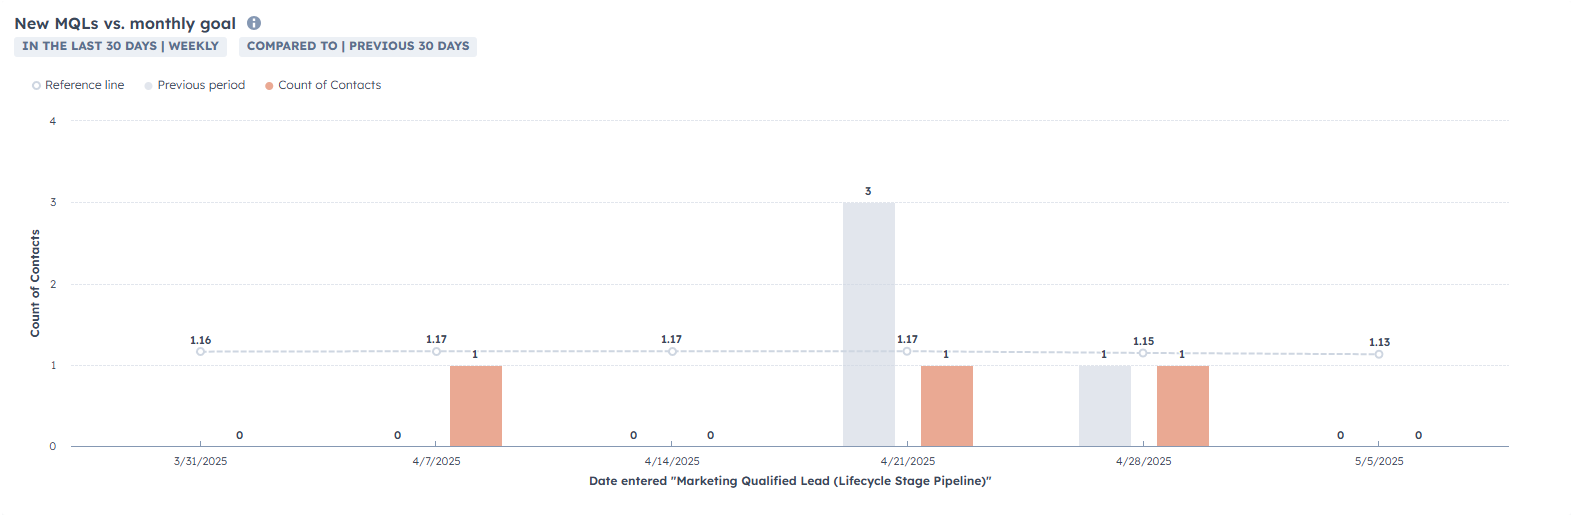
Monthly marketing dashboard showing new MQLs vs. monthly goal.
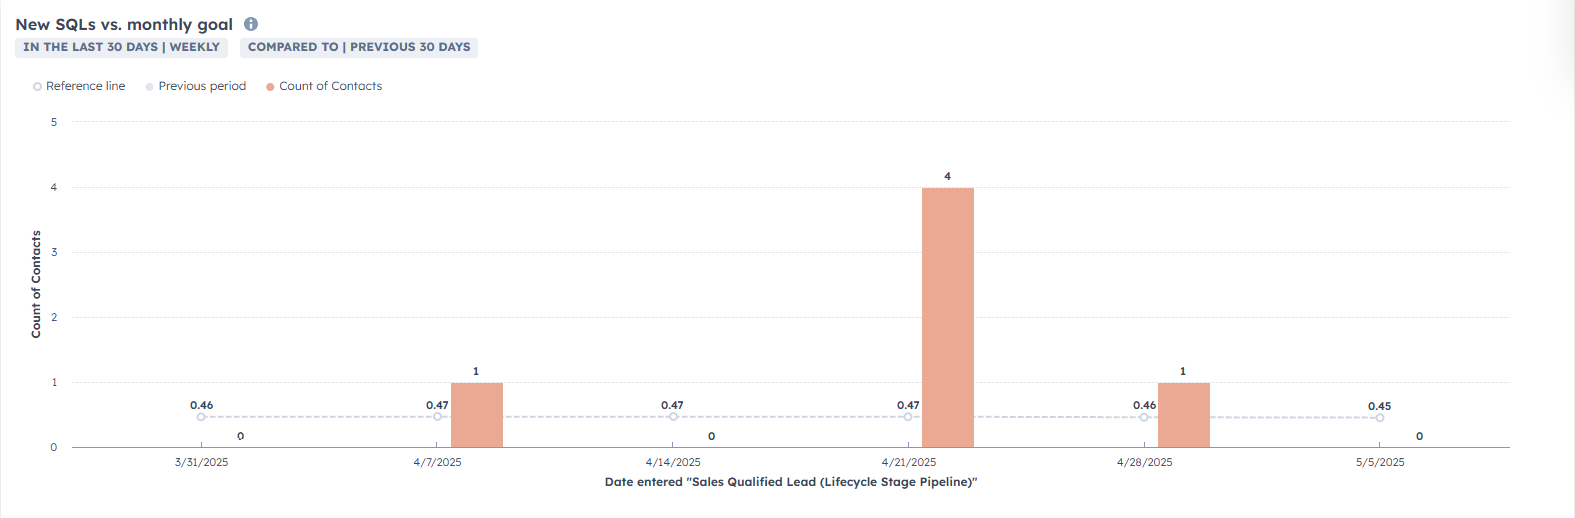
Monthly marketing dashboard showing new SQLs vs. monthly goal.
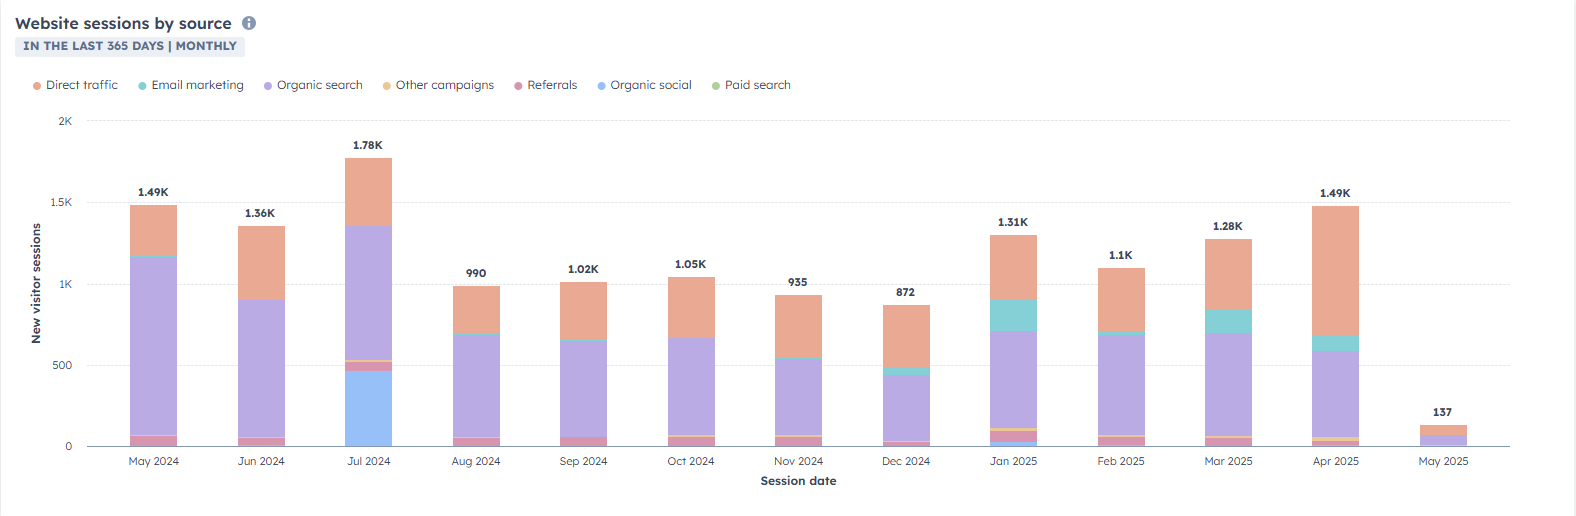
Monthly website traffic sources comparison in HubSpot dashboard.
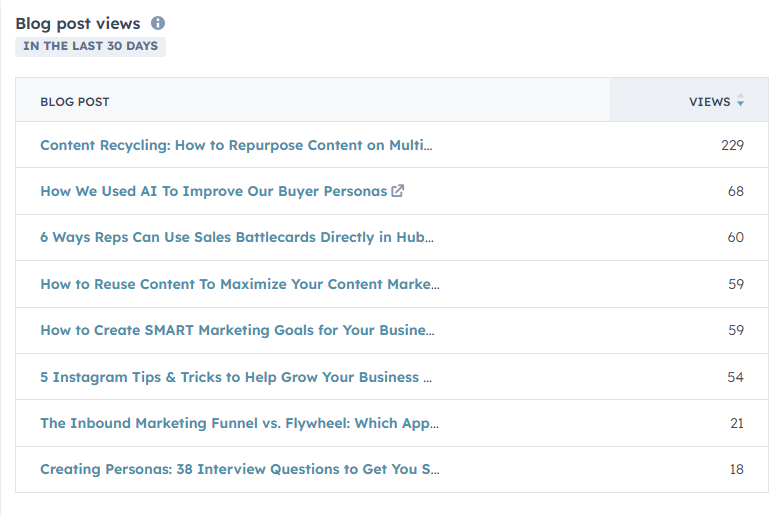
List of top-performing blog posts with view counts for the last 30 days.
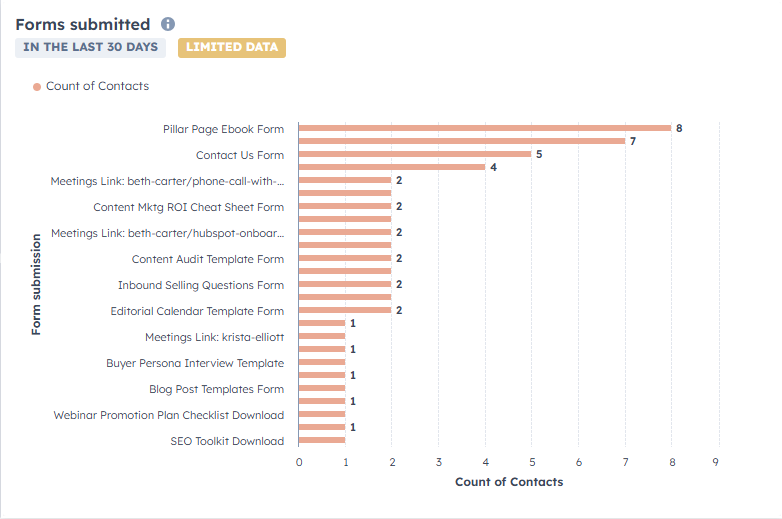
Chart showing number of form submissions from different offers over the last 30 days.
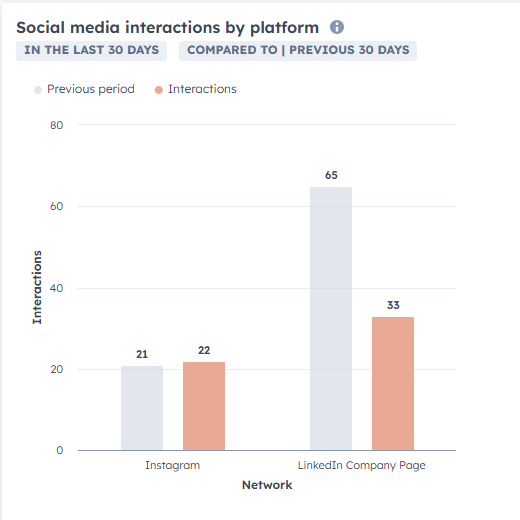
Chart showing number of interactions by social media platform over the last 30 days.
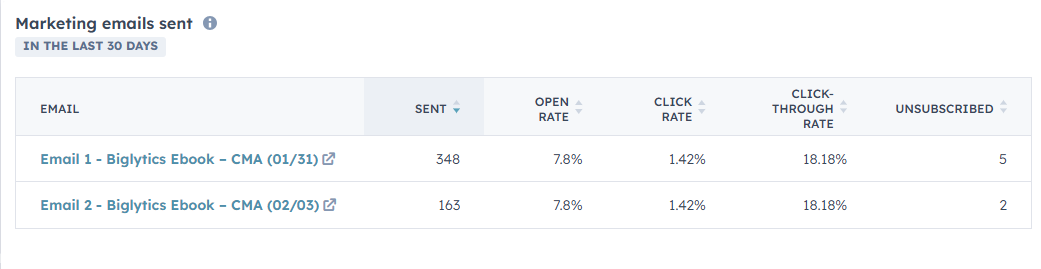
Table showing the performance rate of marketing emails sent over the last 30 days.

Why Quarterly Reporting Matters
Quarterly reporting allows you to step back and identify macro trends across your digital marketing performance. By benchmarking this marketing performance over time, you’re able to refine your marketing strategy based on real data – not gut instincts. Moreover, a quarterly lens helps you avoid "tactical tunnel vision" and stay focused on strategic marketing goals.

At Clariant Creative, we know you don’t have time to build custom reports from scratch — but you still need high-quality reporting to:


Don't waste another minute wrestling with spreadsheets and scattered data. Install the Clariant Creative HubSpot Dashboard Bundle today and start making faster, smarter marketing decisions. Need a hand customizing these dashboards to fit your specific marketing and sales goals? Let’s talk!