·
4 minute read
·
4 minute read

One of the many reasons we love email marketing is that it’s so measurable. At a glance, you can see which campaigns are your top performers across a huge range of metrics.
But what’s harder to know is how your results compare to what your competitors are doing. Is your 20% click-through rate on your latest campaign fantastic? Or just okay?
The fact is there’s a whole world of data to consider when benchmarking email marketing statistics.
Take one simple email marketing metric, for instance: open rate. Pretty straightforward, right? Maybe not. Even if your email gets a great open rate, do you know why? It could have been:
- A great subject line
- A great list of recipients
- Great subject matter
- Great timing
In truth, all of these factors probably had an impact.
The trick, therefore, is to not just identify a great statistic, but to understand all of the factors that drive the statistic. The more of these factors you can get right, the better you’ll be able to catch lightning in a bottle and crush your goals on your next email send.
Below, we’ve compiled a range of email marketing statistics across several studies, and we’ve highlighted the factors that might impact your ability to hit or exceed these benchmarks.
Open Rates
A recent IBM email marketing benchmark study found the overall mean open rate for all emails is 21.8% globally (21.3% in the U.S.). The top quartile actually managed a whopping 58.7%.
That's a ton of variance, and it makes it tough to tell what's a good rate for you. Your actual open rate may be higher or lower than these averages for several reasons:
- Type of email. Transactional emails – such as an email receipt for a purchase – see average open rates as high as 47.1%. (As a side note, this might be an opportunity to incorporate additional marketing or branding within your transactional messages.)
- Send day and time. Email send day and time have a measurable impact on open rates, although it’s less clear which day is best. Most studies concur that Tuesdays win for open rates, although Wednesday and Thursdays also seem to do well. Mid-morning, between 10:00 to 11:00 a.m., seems to be the optimal time to send.
- Industry. Open rates can range from an impressive 30.9% for schools and education to just 18.2% for marketing agencies. Here's the full spread:
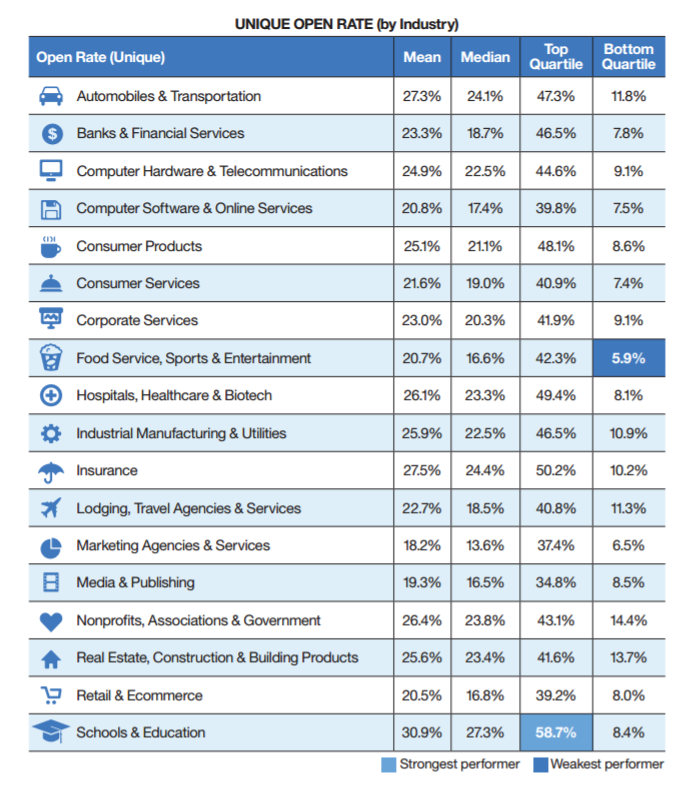
Source: IBM 2016 Email Marketing Benchmark Study
In other words, while 20% is probably a good general open rate to shoot for, your actual target may be a bit different. It’s going to take some trial and error to see what’s a great rate for your company, with your list, in your industry.
Click-Through Rates
Getting a customer to open your email is only half the battle. Ultimately, you want a customer to actually click somewhere in your email and take some sort of action.
According to the IBM study, the overall mean click-through rate is 3.3%. Just to make you a little jealous, the highest performers managed a rate nearly three times higher.
Like open rates, click-through rates will vary based on several factors:
- By type of email. Transactional emails generated 10.4% click-through rates on average.
- By send day and time. Interestingly, Sunday gets the highest click-through rate (2.4% on average). Sunday also happens to generate the lowest open rate. Perhaps on Sunday, people open only those emails they’re most interested in, which means they’re more likely to engage with those emails? Tuesday comes in a close second, with click-through rates hovering around 2.3%.
- By industry. Here again, click-through performance varies across industries, with computer hardware and online service companies reaching 5% on the high end, and a tie for last place at 2.4% for travel agencies and marketing agencies. (What's up with the no love for marketing agencies?)
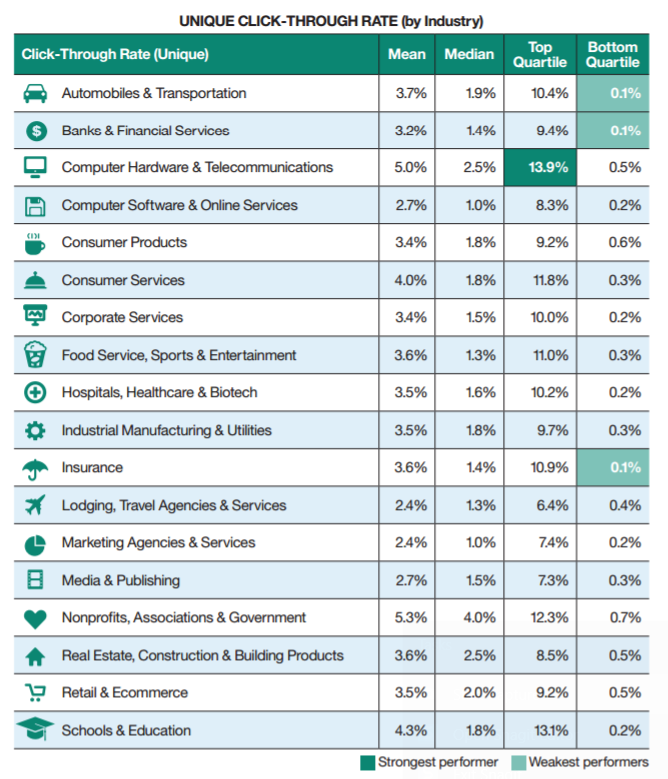
Source: IBM 2016 Email Marketing Benchmark Study
It’s also interesting to note that Yesmail’s 2016 Q2 email performance study found unique click rates have fallen 18% year-over-year. This may indicate that although we’re sending more emails than ever, customers are choosing to engage with fewer of them.
However, although overall clicks may be on the decline, Yesmail says that more clicks are happening on smartphones. Mobile clicks versus desktop clicks have grown by 15% in the past year alone. This means that as you dig into the individual components of your email marketing strategy, optimizing for mobile devices is an absolute must.
Related Content: A Not-By-the-Book Guide to Better Email Marketing Strategies: Segmenting Your List
Churn Metrics
Not every email marketing benchmark is designed to tell you how well you’re doing. List churn metrics such as hard bounce, unsubscribe and complaint (spam) rates are, essentially, measures of reader disengagement and list exhaustion.
The IBM study gives some interesting insights into these metrics:
- Bounce Rates: The mean hard bounce rate is 0.473%. Hard bounces may be a result of invalid email addresses which need to be pruned from your list. Soft bounces occur when an email can’t be delivered for temporary reasons, such as a recipient’s inbox that is full.
- Unsubscribe Rates: The mean unsubscribe rate is 0.127%. Although this number might seem low and therefore unimportant, keep in mind that subscriber opt-outs will steadily decrease the size of your database.
- Spam Complaint Rates: Although the mean complaint rate is only 0.026%, the bottom quartile sees average rates of 0.121%. This means these companies are seeing upwards of 121 complaints per 100,000 emails sent. Generate too many complaints, and you risk damaging your reputation with email service providers.
Certainly, everyone wants to keep churn metrics as low as possible. But beyond simply monitoring these statistics, it’s important to look more closely into what these numbers can tell you about your overall list management, send frequency and ability to deliver on the expectations of your subscribers.
If your email failure rates are spiking, ask yourself:
- Can I segment my email marketing lists more effectively? Maybe you can target specific messages to specific audiences in order to get a more enthusiastic response.
- Am I sending too many emails? Create an editorial calendar to see exactly how many emails specific segments of your customer base are receiving in a month – the results may surprise you (and not in a good way).
- Am I giving my subscribers what they signed up for? Always make sure the content you’re delivering is valuable and in line with what you promised.
What are your email marketing statistics telling you? We can help you make sense of your numbers and develop the best strategy to move forward. Contact us today!